Interested in Infrastructure?
Get Infrastructure articles, news and videos right in your inbox! Sign up now.
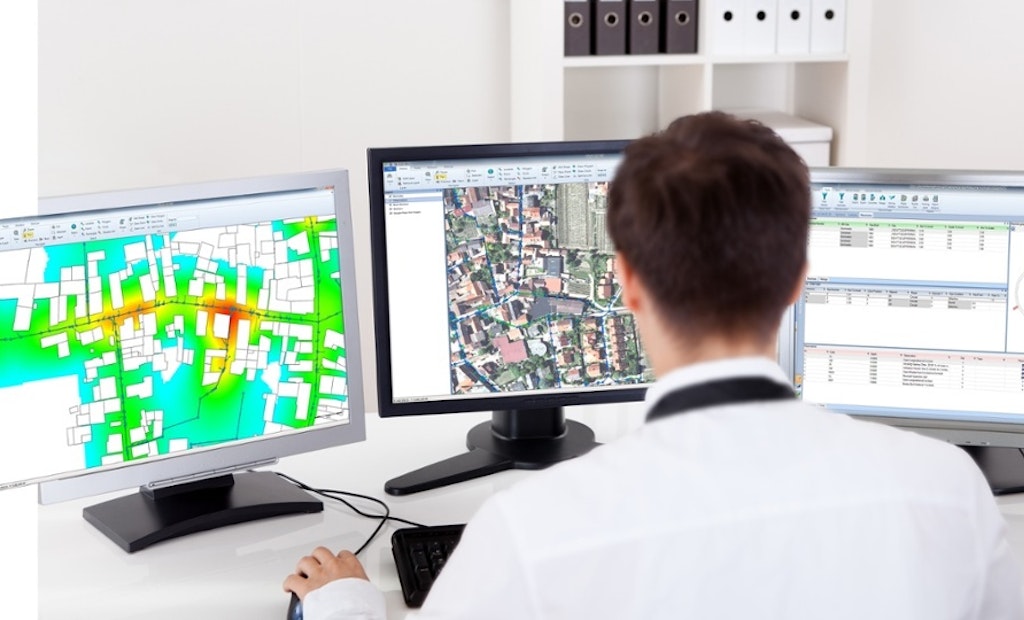
Infrastructure + Get AlertsWhen integrated with ESRI’s ArcGIS platform, WinCan VX sewer assessment software allows users to navigate and analyze inspection data using a rich GIS interface. With it, users can click map features to link to section and defect information, or they can click a tabular record in an inspection to jump immediately to its mapped location. With this bidirectional link between GIS and WinCan, inspections can be pre-populated with data residing in GIS (eliminating manual data entry) and GIS data can be updated with results once an inspection is complete. Beyond simply mapping data, the ArcGIS integration allows users to filter results, create reports, browse media and build heat maps according to defect type or severity. It also assists with workflow by allowing you to select regions, assign them to specific inspection crews and then monitor per-crew progress graphically with color-coded indication.
Although WinCan VX is available with its own native GIS implementation, most municipal customers in the U.S. have standardized on ArcGIS and seek to leverage that platform. In either case, users can navigate, annotate and edit maps using common tools; show/hide map layers; and export map data to a variety of common formats.
“Pipe inspection professionals want an effortless way to correlate inspection data with map locations,” says Mike Russin, business manager for WinCan in the Americas. “The ArcGIS integration offers a full-featured GIS front-end that makes navigating data simple and intuitive. Being able to visualize data in this way is essential to smart, efficient decision-making.” WinCan is an ESRI Silver Business Partner and has ESRI experts on staff that can support both ESRI and WinCan.
Learn more about WinCan software here.


